Prometheus Storage

Using Remote Storage Adapters
Lee Calcote

clouds, containers, functions, applications and their management


Show of Hands

Prometheus Architecture
source: prometheus.io
Understanding and Extending
Prometheus AlertManager
KubeCon EU 2017
Prometheus Architecture
source: prometheus.io
Our Environment
Random Sample Targets
                                $ git clone https://github.com/prometheus/client_golang.git
$ cd client_golang/examples/random
$ go get -d
$ go build
Fetch and compile the client library code example.
Start exampe targets in separate terminals.
                                $ ./random -listen-address=:8080
$ ./random -listen-address=:8081
$ ./random -listen-address=:8082
Create and run random sample targets.
Security
./prometheus --web.enable-admin-api --web.enable-lifecycle

2.x has new flag controls access to the administrative HTTP API
look at prometheus.yml and deploy prometheus
Storage
Prometheus
Local Storage

Targets
a simple approach
Prometheus
Prometheus
Time Series
- a collection of data points over time, linked together into a series.
- each data point is a numeric value associated with a timestamp.
                                series
  ^
  │   . . . . . . . . . . . . . . . . .   . . . . .   request_total{path="/status",method="GET"}
  │     . . . . . . . . . . . . . . . . . . . . . .   request_total{path="/",method="POST"}
  │         . . . . . . .
  │       . . .     . . . . . . . . . . . . . . . .                  ...
  │     . . . . . . . . . . . . . . . . .   . . . .
  │     . . . . . . . . . .   . . . . . . . . . . .   errors_total{path="/status",method="POST"}
  │           . . .   . . . . . . . . .   . . . . .   errors_total{path="/health",method="GET"}
  │         . . . . . . . . .       . . . . .
  │       . . .     . . . . . . . . . . . . . . . .                  ...
  │     . . . . . . . . . . . . . . . .   . . . .
  v
    <-------------------- time --------------------->
one sample is 16 bytes = timestamp (8 bytes) + value (8 bytes)
metric name
labels
time
Container Orchestrators & Churn
                                series
  ^
  │   . . . . . .
  │   . . . . . .
  │   . . . . . .
  │               . . . . . . .
  │               . . . . . . .
  │               . . . . . . .
  │                             . . . . . .
  │                             . . . . . .
  │                                         . . . . .
  │                                         . . . . .
  │                                         . . . . .
  v
    <-------------------- time --------------------->
Designed a new storage layer that aims to make it easier to run Prometheus in environments like Kubernetes, and to prepare Prometheus for the proliferating workloads of the future.
New storage system in 2.0
-
is sufficiently separate from Prometheus, so as to be generally reusable.

1.x Problems
- Too many inodes
- Empty inode takes 4KB
- Index - hash as series id with receipt of each sample
2.x Improvements
- Switched to time-sharding
- Inverted Index reduces index size.
- cutting down the number of series touched in queries
- Using mmap
                                    t0            t1             t2             t3             now
 ┌───────────┐  ┌───────────┐  ┌───────────┐  ┌───────────┐
 │           │  │           │  │           │  │           │                 ┌────────────┐
 │           │  │           │  │           │  │  mutable  │ <─── write ──── ┤ Prometheus │
 │           │  │           │  │           │  │           │                 └────────────┘
 └───────────┘  └───────────┘  └───────────┘  └───────────┘                        ^
       └──────────────┴───────┬──────┴──────────────┘                              │
                              │                                                  query
                              │                                                    │
                            merge ─────────────────────────────────────────────────┘
512MB per block
Compaction
To overhead from promql query and graph generation.
Compression
1.x - based on previous sample - 16 bytes of storage
2.x - Batch compressing chunks of many samples of a series, in memory, squeezes each data point down to an average 1.37 bytes of storage.
Backups
Blocks are immutable.
Snapshot by hard linking all the blocks.
Retention
1.x not sharded on time; had to cycle through all old chunks and determine if samples were past retention time.
2.x layout also makes it trivially easy
                                                      |
 ┌────────────┐  ┌────┼─────┐  ┌───────────┐  ┌───────────┐
 │ 1          │  │ 2  |     │  │ 3         │  │ 4         │   . . .
 └────────────┘  └────┼─────┘  └───────────┘  └───────────┘
                      |
                      |
             retention boundary
see fabxc.org/tsdb/
Snapshots
curl -XPOST http://localhost:9090/api/v2/admin/tsdb/snapshot
./prometheus --web.listen-address=0.0.0.0:9091 --web.enable-admin-api --storage.tsdb.path=./data/snapshots/
./prometheus --web.enable-admin-api --web.enable-lifecycle
Remember 2.x's new security model.
Take a snapshot.
Start a new Prometheus and point to snapshot.
backing up prometheus
Migrating
Your Prometheus 1.8 instance should be started with the following flags and an config file containing only the external_labels setting (if any):
                                remote_read:
  - url: "http://x.x.x.x:9094/api/v1/read"
./prometheus-1.8.1.linux-amd64/prometheus -web.listen-address ":9094" -config.file old.yml
Prometheus 2.0 can then be started (on the same machine):
./prometheus-2.0.0.linux-amd64/prometheus --config.file prometheus.yml
Add this stanza to your prometheus.yml
upgrading from 1.x
Local Storage Challenges
an ephemeral sliding window of recent data
Prometheus stores sample data on disk in a highly optimized custom format based on flat files.
-
efficient
-
tunable
-
NOT scalable
-
NOT durable
                                ./data/01BKGV7JBM69T2G1BGBGM6KB12
./data/01BKGV7JBM69T2G1BGBGM6KB12/meta.json
./data/01BKGV7JBM69T2G1BGBGM6KB12/wal
./data/01BKGV7JBM69T2G1BGBGM6KB12/wal/000002
./data/01BKGV7JBM69T2G1BGBGM6KB12/wal/000001
./data/01BKGTZQ1SYQJTR4PB43C8PD98
./data/01BKGTZQ1SYQJTR4PB43C8PD98/meta.json
./data/01BKGTZQ1SYQJTR4PB43C8PD98/index
./data/01BKGTZQ1SYQJTR4PB43C8PD98/chunks
./data/01BKGTZQ1SYQJTR4PB43C8PD98/chunks/000001
./data/01BKGTZQ1SYQJTR4PB43C8PD98/tombstones
./data/01BKGTZQ1HHWHV8FBJXW1Y3W0K
./data/01BKGTZQ1HHWHV8FBJXW1Y3W0K/meta.json
./data/01BKGTZQ1HHWHV8FBJXW1Y3W0K/wal
./data/01BKGTZQ1HHWHV8FBJXW1Y3W0K/wal/000001
./data/01BKGV7JC0RY8A6MACW02A2PJD
./data/01BKGV7JC0RY8A6MACW02A2PJD/meta.json
./data/01BKGV7JC0RY8A6MACW02A2PJD/index
./data/01BKGV7JC0RY8A6MACW02A2PJD/chunks
./data/01BKGV7JC0RY8A6MACW02A2PJD/chunks/000001
./data/01BKGV7JC0RY8A6MACW02A2PJD/tombstones
Prometheus Local Storage
Remote Storage
a long-standing issue
#10
Native Remote Write
Legacy
1.x provided write-only support for OpenTSDB, Graphite, InfluxDB
removed -storage.local.* flags
Storage Adapters
Prometheus
Remote Storage Adapter
The solution is a remote storage adapter.
3rd Party Storage
Adapter
Prometheus
custom protocol
write samples
request: matchers + time ranges
receive: series + samples
Adapter: an application that can receive batches of samples from Prometheus over HTTP and send them to some backend.
Adapters
List
Adapters
Configuration
                                # The URL of the endpoint to send samples to.
url: <string>

# Timeout for requests to the remote write endpoint.
[ remote_timeout: <duration> | default = 30s ]

# List of remote write relabel configurations.
write_relabel_configs:
  [ - <relabel_config> ... ]

# Sets the `Authorization` header on every remote write request with the
# configured username and password.
basic_auth:
  [ username: <string> ]
  [ password: <string> ]

# Sets the `Authorization` header on every remote write request with
# the configured bearer token. It is mutually exclusive with `bearer_token_file`.
[ bearer_token: <string> ]

# Sets the `Authorization` header on every remote write request with the bearer token
# read from the configured file. It is mutually exclusive with `bearer_token`.
[ bearer_token_file: /path/to/bearer/token/file ]

# Configures the remote write request's TLS settings.
tls_config:
  [ <tls_config> ]

# Optional proxy URL.
[ proxy_url: <string> ]
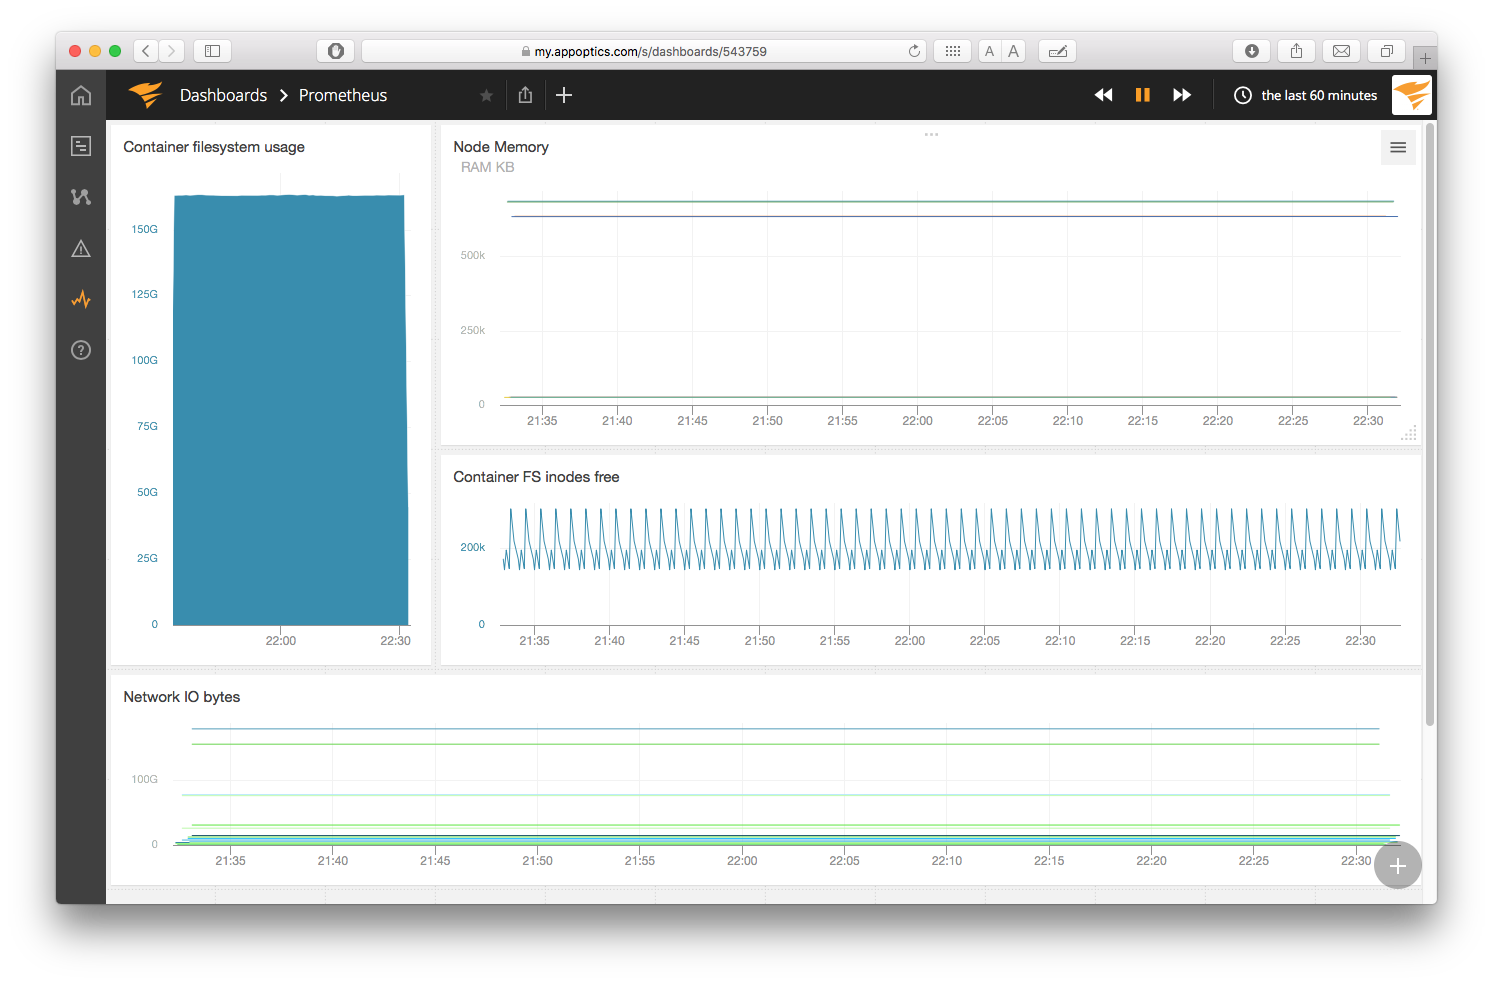
AppOptics Remote Storage Adapter
prometheus2appoptics
- batching
- translation
POST /v1/measurements
POST /receive
1000 Samples per POST
app optics

Prometheus
                                remote_write:
  - url: "http://localhost:4567/receive"
                                docker run --env ACCESS_TOKEN=1d7c3ced4caa7f4939bd16c9c1b6578ae93d7b3b597a39633a6656fe198e796d \
--env SEND_STATS=true -p 4567:4567 solarwinds/prometheus2appoptics
Deploy adapter
Config remote write
deploy remote storage adapter
curl -X POST http://localhost:9090/-/reload
Reload config
Verify remote storage adapter
                                curl -XPOST -g \
'http://localhost:9090/api/v1/admin/tsdb/delete_series?match[]=go_memstats_alloc_bytes'
$ curl -XPOST http://localhost:9090/api/v1/admin/tsdb/clean_tombstones
Delete time series 'go_memstats_allocbytes'
Delete tombstones
Verify long-term storage
delete local storage and see long-term storage retained
Verify local storage
Resources
IRC: #prometheus on irc.freenode.net
Mailing lists:
-
prometheus-users – discussing Prometheus usage and community support
-
prometheus-developers – contributing to Prometheus development
Prometheus repositories to file bugs and features requests
#

Lee Calcote
Thank you. Questions?
clouds, containers, functions,
applications and their management

AppOptics Prometheus Storage Integration

AlertManager
Prometheus
Alertmanager is an alert...
Purpose
ingester
grouper
de-duplicator
silencer
throttler
notifier
\ˈnō-mən-ˌklā-chər
a brief Prometheus AlertManager construct review
match alerts to their receiver and how often to notify
where and how to send alerts

- Silencers - matches alerts with specific labels and prevents them from being included in notifications.
- Inhibitors - suppress specific notifications when other specific alerts are already firing.
- Grouping - categorizes alerts of similar nature into a single notification.
\ˈnō-mən-ˌklā-chər
a brief Prometheus AlertManager construct review
Muting
Suppressing
Correlating
                                group_wait: 30s

group_by: ['alertname', 'cluster']

group_interval: 5m
Multiple approaches to suppression
vs
vs
per route
global
via ui / api
Alerts
                                ALERT <alert name>
   IF <PromQL vector expression>
   FOR <duration>
   LABELS { ... }
   ANNOTATIONS { ... }
Supports clients other than Prometheus
is notified when alerts transition state
a shared construct
Prometheus
AlertManager
inactive
firing
pending
state transition
inactive
firing
notifications
!
Notification Integrations


Notifying to Multiple Destinations
Use continue to advance to next receiver.
                                route:
 receiver: email_webhook

receivers:
  - name: email_webhook
    email_configs:
      - to: 'lee@example.io'
    webhook_configs:
      - url: <webhook url here>
Use a receiver that goes to both destinations.
                                route:
 receiver: ops-team-all  # default
 routes:
   - match:
       severity: page
     receiver: ops-team-b
     continue: true
   - match:
       severity: critical
     receiver: ops-team-a

receivers:
  - name: ops-team-all
    email_configs:
      - to: ops-team-all@example.io
  - name: ops-team-a
    email_configs:
      - to: ops-team-a@example.io
  - name: ops-team-b
    email_configs:
      - to: ops-team-b@example.io
or
api
Inhibitor
!
de-duplication
Dispatcher
Non-HA AlertManager Architecture
Silencer
| Dispatcher sorts incoming alerts into aggregation groups and assigns the correct notifiers to each. |
Alert Provider
UI
Silence Provider
store
de-duplication
subscribe
Router
batched alerts
notification pipeline
Notify Provider
| checks for previously sent notifications |
Retry
Retry
Maintenance Script
alerts
High Availability
being introduced in 0.5
I
gossip protocols.
built atop Weave Mesh
With HA, you no longer have to monitor the monitor.
Designed for an alert to be sent to all instances in the cluster.
All Prometheus instances send alerts to all Alertmanager instances.
Guarantees notifications to be sent at least once.